Experience seamless road condition assessment with Hawkeye Insight, the web-based tool designed for visualising and analysing collected data effortlessly.
Insight utilises the familiar mapping functionality of Google Maps, allowing the user to navigate through their collected data and assess the condition of their roads.
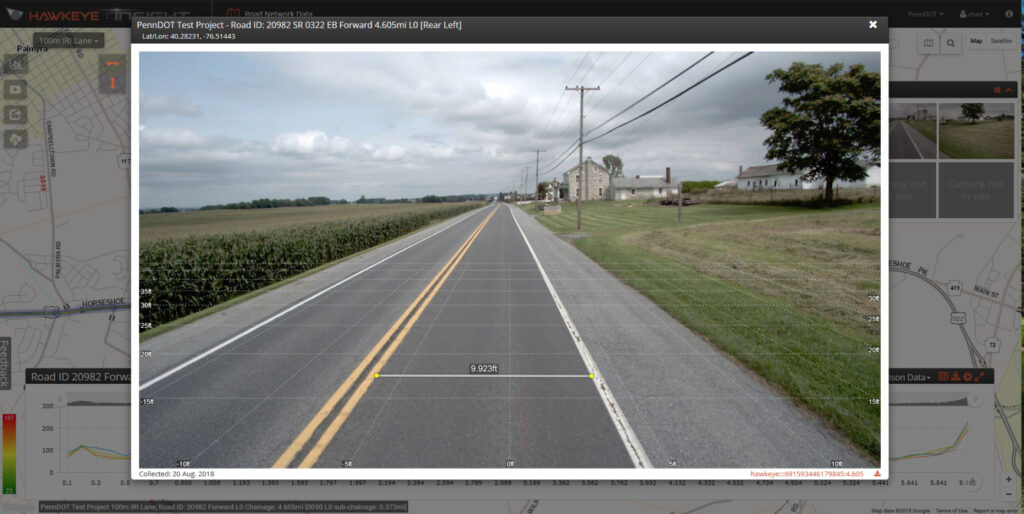
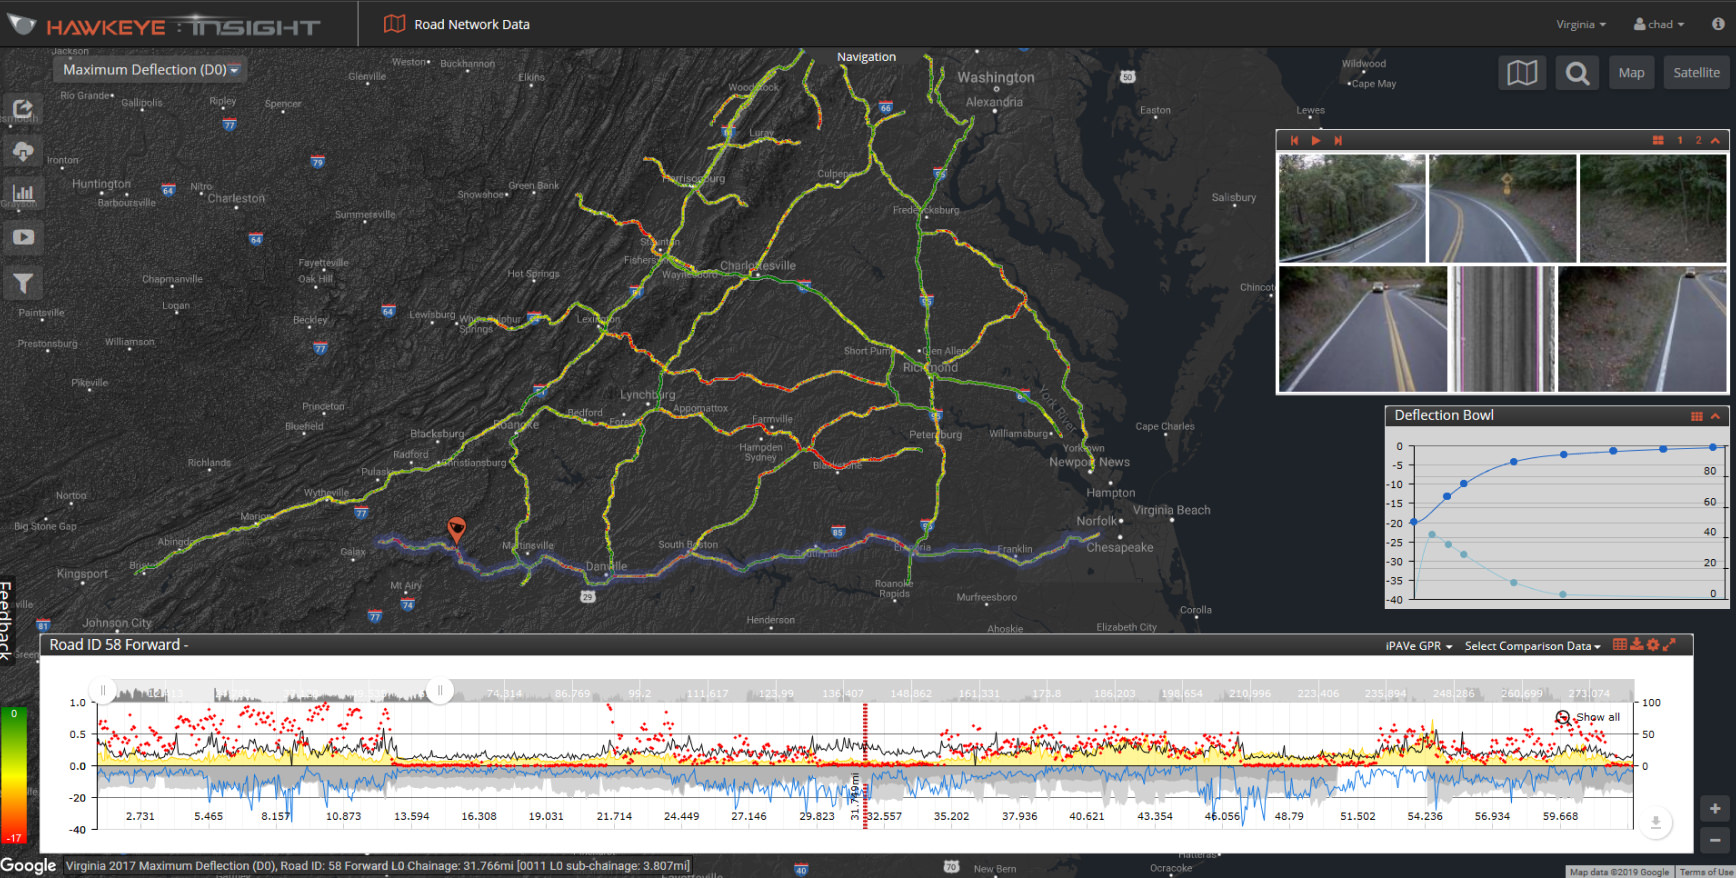
Hawkeye Insight offers multiple concurrent video channels, enabling users to virtually ‘drive’ their roads. Each calibrated camera provides advanced zoom, measurement, and inspection capabilities, including automatic crack detection data. Easily enter road numbers, distance information, or pan to your desired location for instant analysis.
Over 476,852.01 kms / 296,302.10 miles of survey data from across four continents has been published, including deflection bowls and slopes, cracking, rutting, roughness, geometry, pavement distresses and friction. This data is then accessed by road owners, to assist in management of their road networks.
Advanced filters for heatmaps
When surveying with the iPAVe, heatmap filters allow users to easily determine the quality of the road surface and underlying pavement layers.
Previous
Next
Precise location identification
View exact locations via road name, number, or latitude/longitude, ensuring accurate and detailed geographic data for all users.
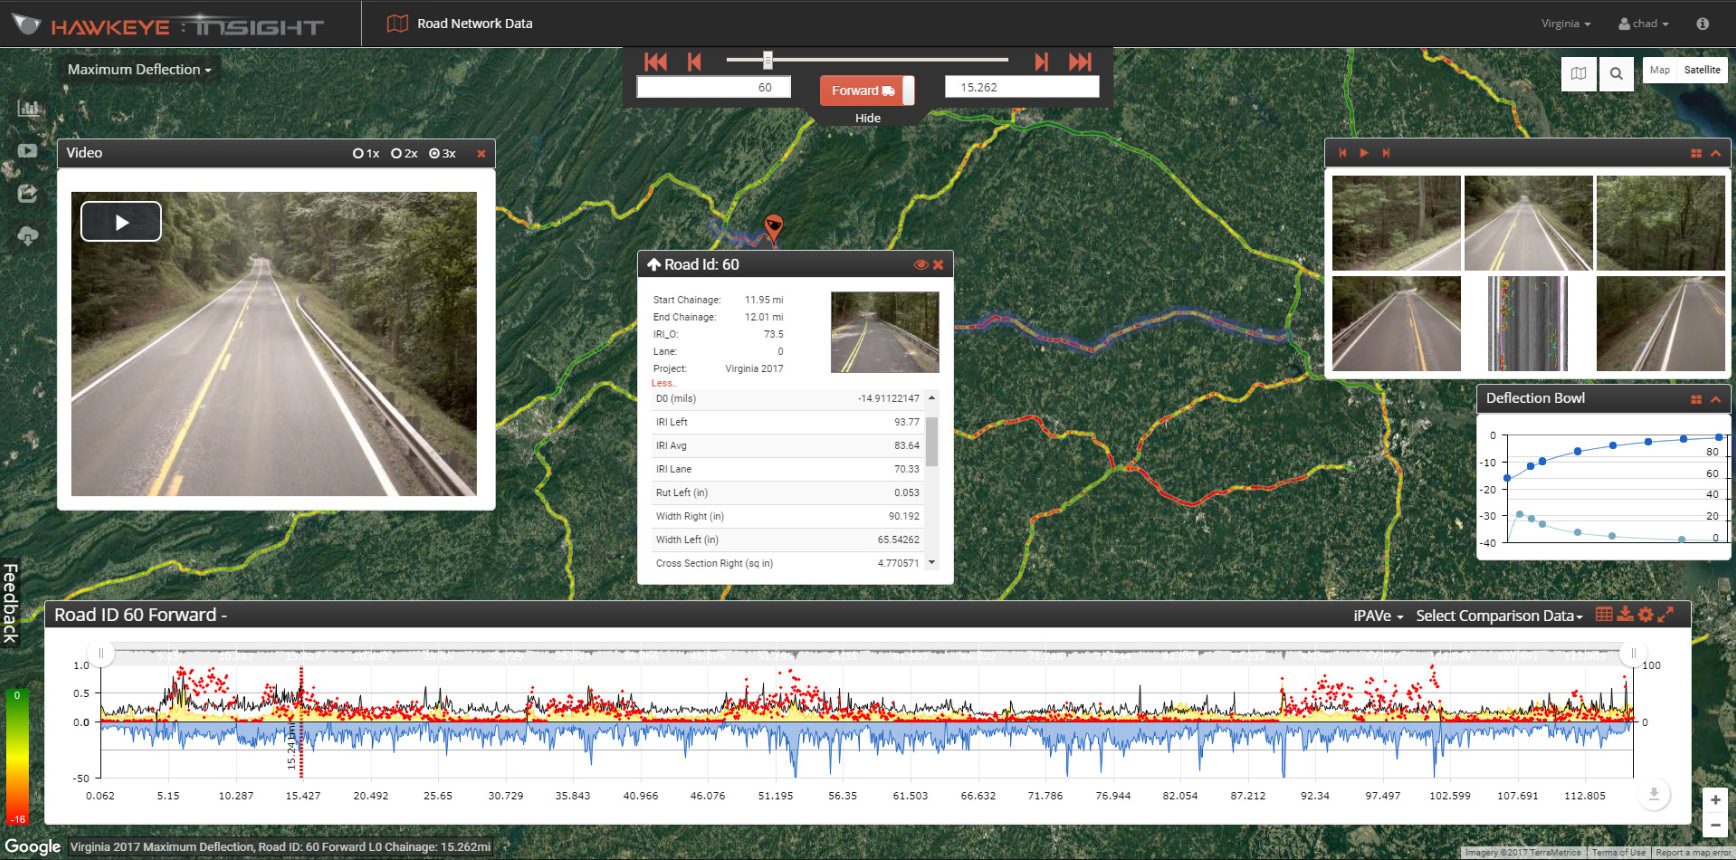
Comprehensive data visualisation
Display individual images alongside output charts, integrating Google Maps for easy and intuitive visual analysis of data.
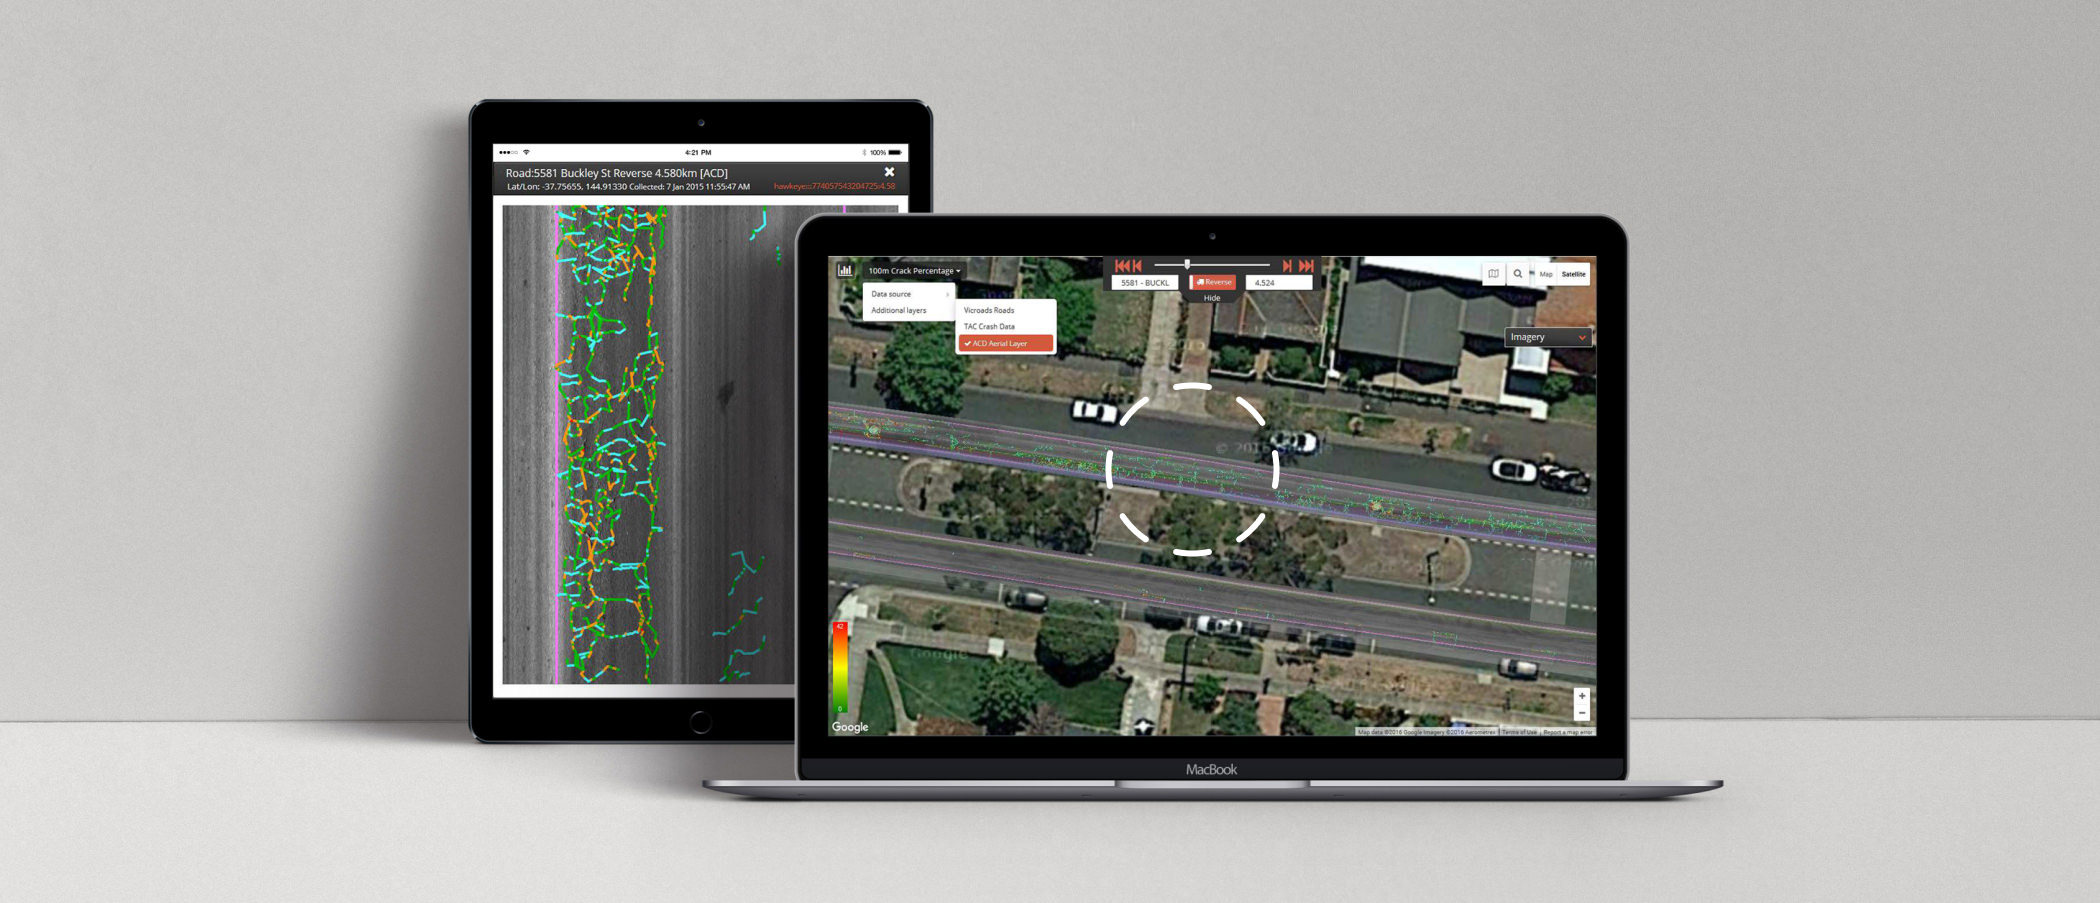
Cloud-based accessibility
Access data from anywhere on various platforms, overcoming common IT issues and eliminating the need for software installation.
Advanced and customisable filters
Utilize advanced filters for heatmaps and custom parameters, enabling detailed and specific data retrieval, including deflection and surface condition.
Integrated and modular design
Benefit from a fully integrated data collection system with a modular design, allowing easy adoption of new technology and expansion as needs change.
Efficient and safe data collection
Collect all condition data and imagery in a single pass with the Heartbeat Module, ensuring safe and efficient surveys for both urban and highway environments.
Hawkeye Insight advanced features
Data Visualization and Analysis
Customizable Data Layers: Display multiple data layers for comprehensive analysis.
Advanced Filtering: Filter map data based on various attributes to identify specific areas of interest.
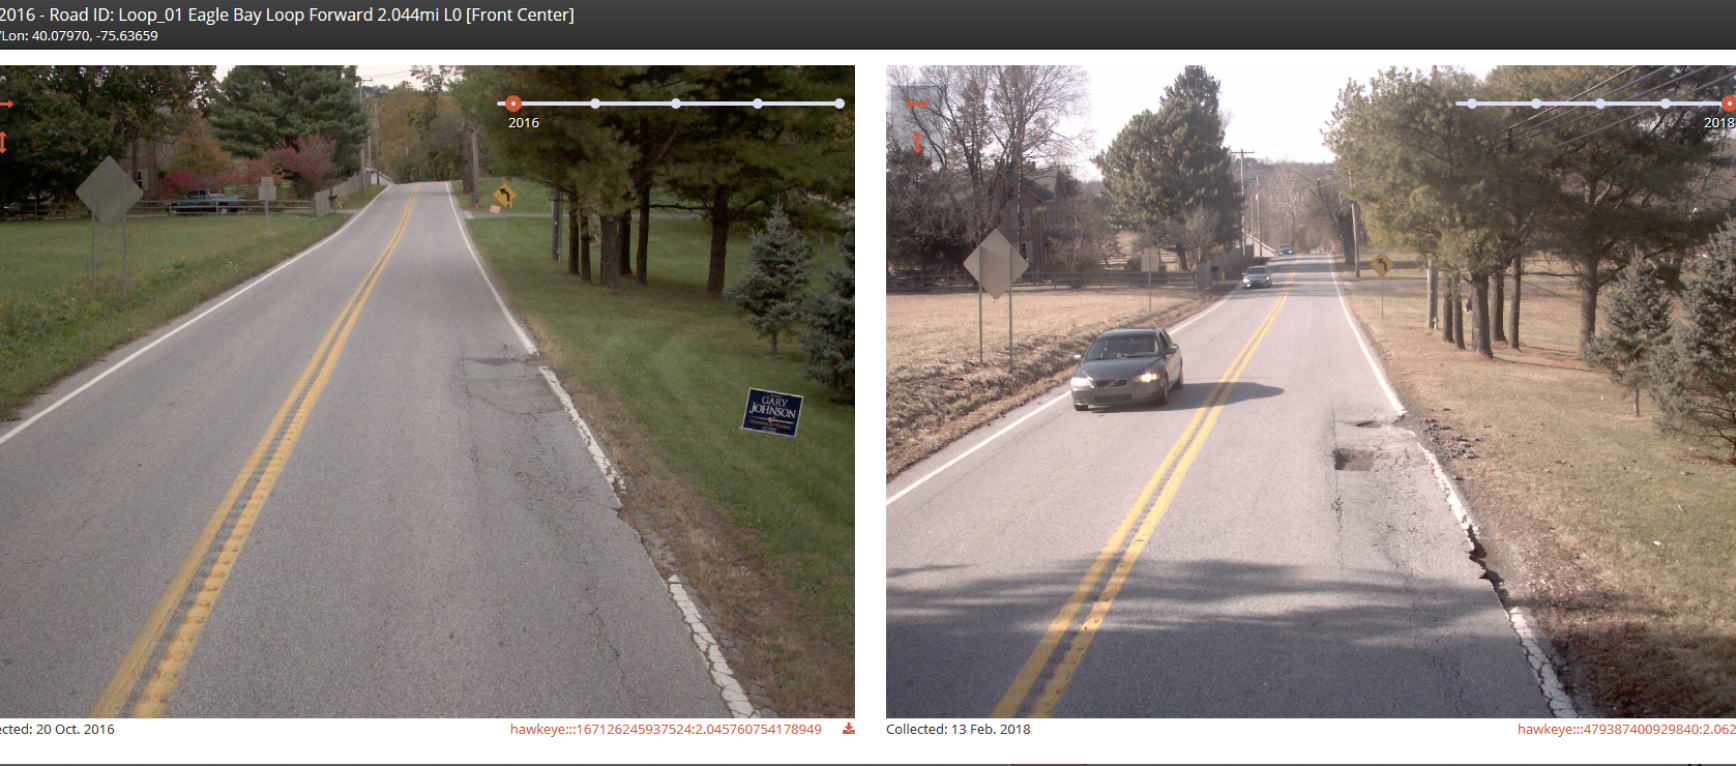
Multi-Year Comparisons: Compare road conditions over time using year-on-year data visualization.
Crack Detection Analysis: Analyze crack detection data through charts, numeric values, and satellite views.
Interactive Mapping
Intuitive Navigation: Easily navigate through your road network using familiar Google Maps functionality.
Video Analysis: Review video footage, measure assets, and identify defects with integrated video capabilities.
Heatmap Analysis: Use heatmaps to assess road surface quality and underlying pavement layers.
Data Management and Sharing
Data Sharing: Share video imagery, charts, Hawkeye URLs, and desktop views via email.
Data Export: Export data for further analysis or integration with other systems.
Advanced Features
Multiple Channel Video: View up to 9 video channels simultaneously for comprehensive analysis.
High-Speed Video: Stream high-quality video at speeds up to 30 fps.
Accurate Measurements: Measure road and asset features with precision using the zoom function.
Network Navigation: Efficiently navigate your road network using road numbers, distance information, or drag-and-drop functionality.
Hawkeye Insight feature
Hawkeye Insight Navigation feature
Key road assessment applications
ARRB’s cutting-edge solutions can applied in various scenarios to enhance road safety, maintenance, and overall infrastructure efficiency.
Airport runway and tarmac inspections?
Inspect runways and tarmacs for damage or wear, ensuring the safety and reliability of airport operations.
Contractor quality control?
Monitor and evaluate the work of contractors to ensure compliance with project requirements and quality standards.
Quality acceptance programmes?
Verify the quality of newly constructed or repaired roads to ensure they meet required standards and specifications.
Road geometry and mapping
Perform precise surveys to map road geometry, aiding in planning and construction projects.
Case study
Hawkeye Insight: City of Raleigh
The City of Raleigh, the Capital City of the State of North Carolina, remains one of the fastest growing metropolitan areas in the USA.
The Hawkeye system has revolutionised our approach to road maintenance.
Its accuracy and efficiency in data collection and analysis have significantly improved our decision-making processes.